Factors Affecting Housing Availability and Affordability in Olympia
September 6, 2019. Jay Elder
A growing crisis forOlympia and other coastal cities over the last two decades is an increasing percentage of people who can't afford housing, which is a factor causing increasing homelessness.
There are many influences on housing prices and peoples' ability to buy or rent in Olympia besides inflation: population change, economic booms and busts, income inequality, jobs available, residential speculation by investor groups, vacancy rate, interest rates, and profit margins determining whether builders build or banks lend, resulting in gentrification. I will explore each of these factors, using local data sources when possible, and government agency data or analyses by universities and non-partisan non-profits. I will post their links so that you can check them out.
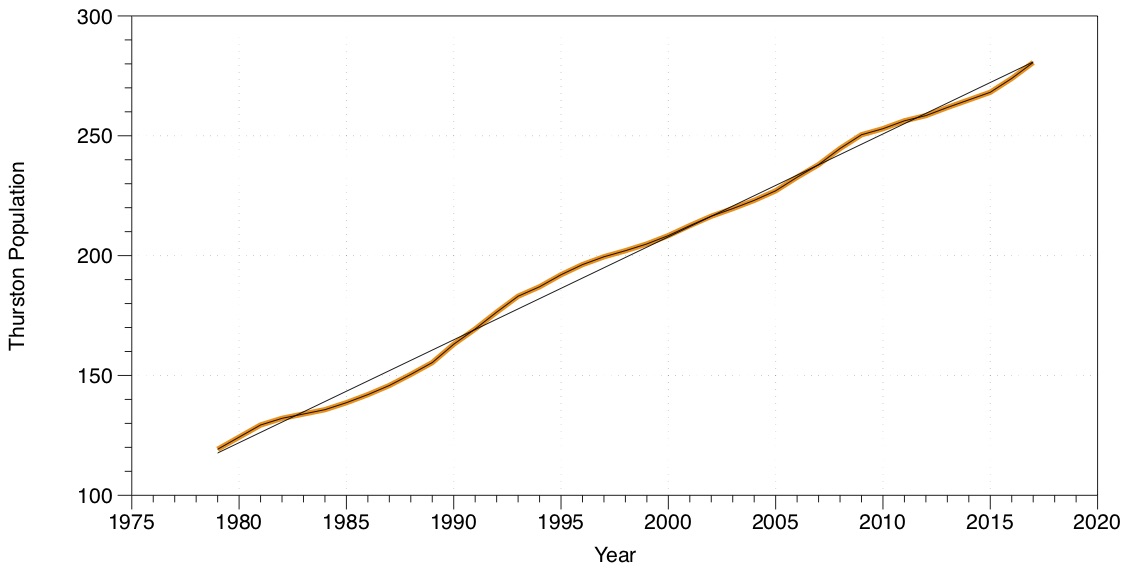
Population Growth:
According to the 2018 Census, Thurston County population has grown steadily by about 4000 people per year since 1979. So accelerated population growth shouldn’t be more of a problem in Thurston County now than it was in 1979. However, in Olympia alone, about 20,000 new people are predicted to live here in the next 20 years. Thurston County population at right is in THOUSANDS.
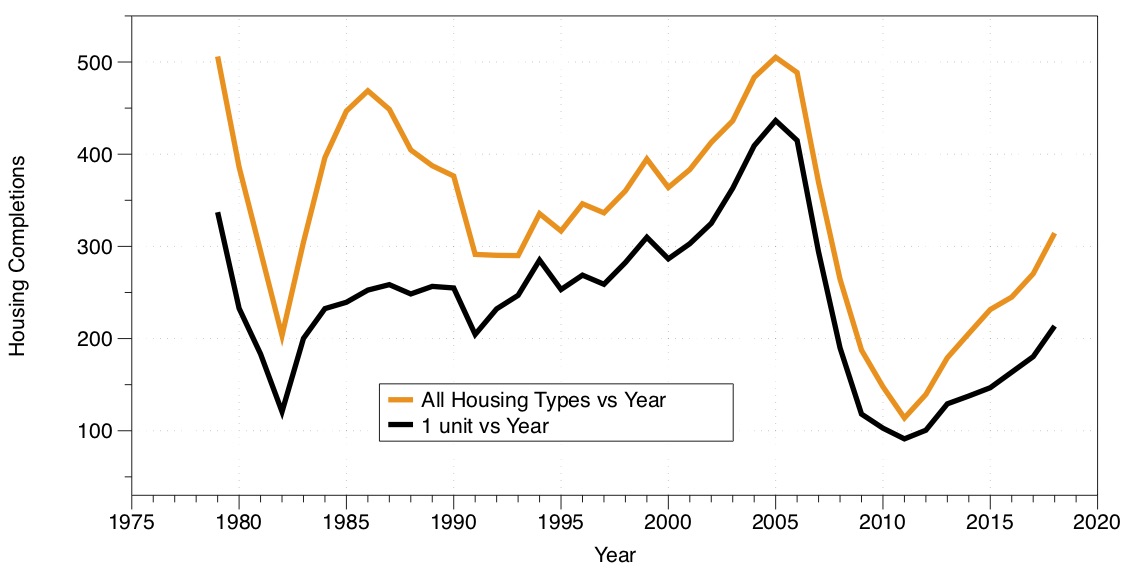
Boom and Bust Cycles:
Our economy goes through booms and busts regularly. During booms, people have more money, vacancy rates decrease, housing is expensive to buy and profitable to build, and contractors build more units in response. The opposite is true in busts. In the US since 1979, how many housing units were completed each year (I couldn’t find data for that far back for Thurston County or Olympia)? Housing completions are in thousands.
https://www.census.gov/construction/nrc/historical_data/index.html (see “Completed”)
The Census says US housing unit completions per year have gone through large boom and bust cycles. Extreme slumps occurred around 1982 and 2008 to 2013. A moderate slump came between 1990 to 1993. These were very good times to buy houses and materials, and to hire labor. The year around 1986, 2005, and NOW were not. There will be more booms and busts in the future.
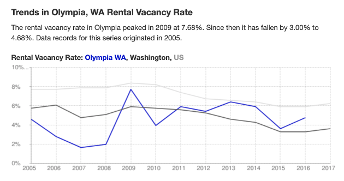
Olympia rental vacancy rates increased sharply just after the 2008 recession began. Vacancy rates then fell to less than 3% into 2019.
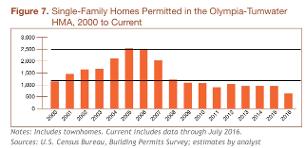
For houses in Olympia, housing starts were still in a slump through 2016, and for a 9 year period, an inadequate housing inventory was added (see lower left chart).
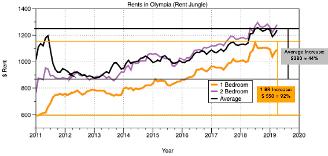
After 2015, people who hadn't had enough money to rent or buy during the recession, saw their economic situation improve rapidly. This pent-up drove market rate prices for houses and rents to increase rapidly, contributing to evictions and homelessness.
Average rent prices went up by about 44% from 2012 to 2019, while 1-bedroom apartments increased 92% while inflation went up 10% during the same time.
https://www.rentjungle.com/average-rent-in-olympia-wa-rent-trends/
I bought my house under much different conditions than exist now; the recession of 1981-1982, as opposed to the housing shortage of today. During this time, materials and labor were very cheap, because construction was almost non-existent (much like 2008 - 2013). So I got a good deal on my house: price, material costs, labor to renovate, and permit and impact fees were very low.
In 1982, I bought my house for about $21/square foot. What is the average cost per square foot now for existing comparable houses sold near my neighborhood in 2018 and 2019 (comparables from Thurston Geodata)?
http://tcproperty.co.thurston.wa.us/AplusAddOn/SalesNBHDPrint.aspx?parcel=81500001000
It's $189 per square foot, about 9 times as much as I paid in 1982. and about 3.5 times the rate of inflation. All I've proven is that housing has gotten very expensive and has risen in price much faster than inflation.
How much does it cost to CONSTRUCT a basic house in Olympia in 2019? According to Remodeling Calculator, in 98506, to build a 1176 sf house, it would cost from $121/square foot to $151/square foot, for a medium-quality house, averaging $135 per square foot. This is a lower per-square-foot price than my house today, because my house includes land, permit fees, installed utilities, and the remodeling calculator doesn't.
https://www.remodelingcalculator.org/house-building-calculator/
New construction is expensive, and it's difficult to create new housing that is also affordable when land, utilities and fee are added.
Income Inequality:
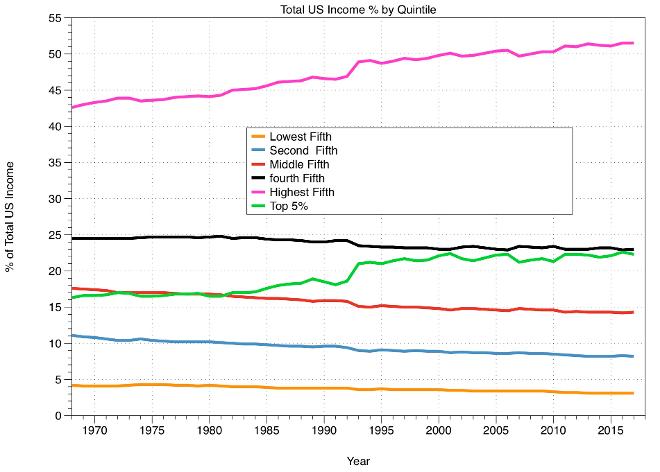
Since 1980, union-busting, wage stagnation, loss of job benefits, automation and exporting of jobs have caused the lowest 80%, and especially the lowest 40% of US earners to lose, or barely maintain their buying power. Almost all increased buying power went to the top 20%, of earners, but especially the top 5% and ESPECIALLY to the top 1%.
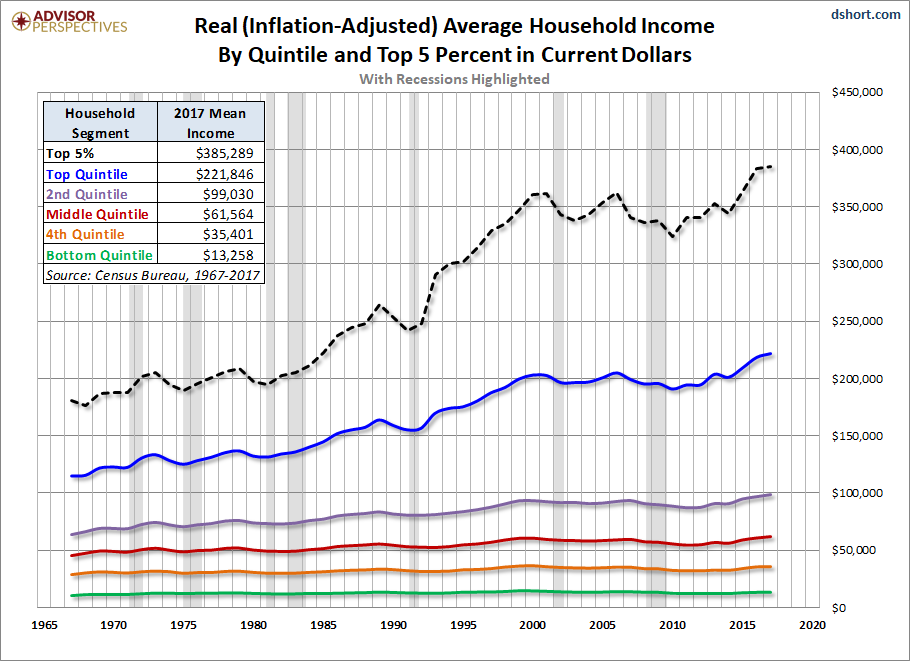
Put another way, the percentage of total US income that each quintile (20%) of households gets is shown in the graph below. As you can see, the share of total US income dollars for the bottom 80% of earners has DECREASED over the last 50 years.
https://www.census.gov/data/tables/time-series/demo/income-poverty/historical-income-households.html (Table H2, All Races)
But younger people have suffered the most. Who is trying to rent/buy houses? Generally people from 25 to 44. The real household incomes, especially for people from age 25 to 34 years old, saw a decrease in buying power from 2007 to 2015 (see below, red box).
Notice that their incomes began to climb sharply after 2015 (increases continued through 2019). This gave rise to very-high demand for single-family houses. Families who hadwanted to buy a house for 8 years, could now suddenly afford one. They all wanted a house RIGHT NOW, and prices skyrocketed.
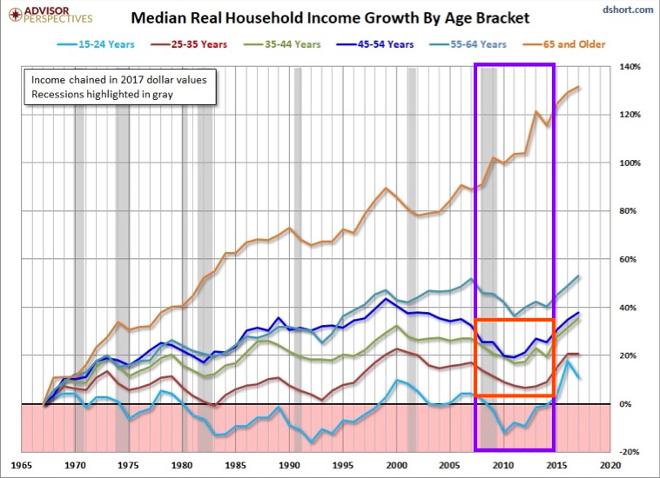
THIS is a major cause of unaffordable housing. No matter how many houses or new apartments there are, unless they are very small, they will be unaffordable to the lowest 50% of earners, and especially in those age groups who need them.
Jobs Available:
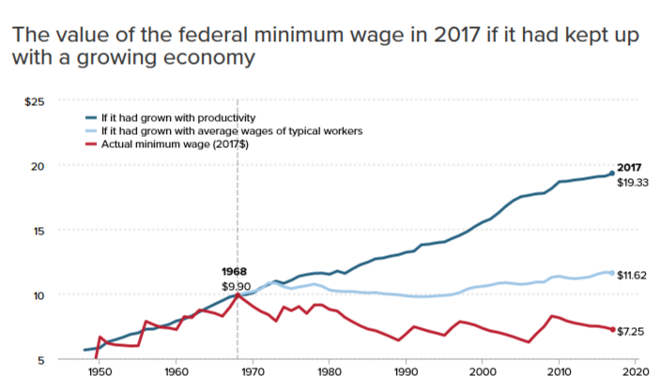
The types of jobs available and their pay/benefits have changed radically in the last 10 years. Minimum wage hasn't come close to keeping up with the cost of living. Compounding these lower wages is the fact that many businesses have dispensed with full-time jobs in favor of many part-time positions, for which they need not give benefits or vacation, or even regular hours.
Minimum wage jobs just don't provide enough money for housing. The minimum wage's real buying power is 30% less than it was in 1968, and 20% less than it was in 2012.
https://www.usw.org/blog/2018/the-u-s-economy-can-afford-a-15-minimum-wage
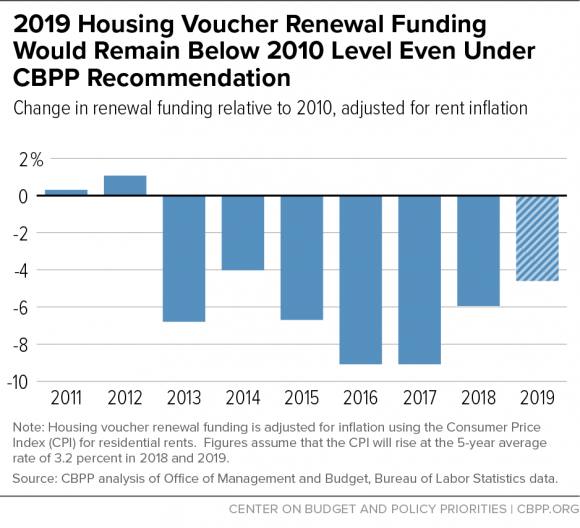
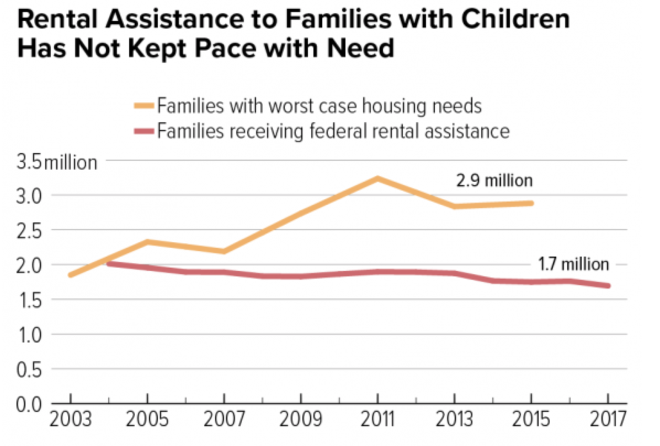
But isn't there federal funding to subsidize the housing of the very poor: HUD? For families making less than 30% of the local median household income, who are constantly vulnerable to being homeless, HUD (Housing and Urban Development) has supplied a limited number of Housing Vouchers in the past, which subsidize rents. However, funding for these vouchers has been continually cut since 2012, so there have been no new vouchers available for years. In the 2020 proposed Trump budget, an additional 20% of funding will be cut from 2019. This means the working poor in Olympia will not catch a break from the federal government.
Residential Speculation by Institutional Investment Groups
A new phenomenon since 2000 has been a major cause of increasing rents and house prices, accelerating since 2009: residential housing is being bought increasingly by investor groups instead of owner occupiers. This means that what used to be a nest egg for an owner-occupier now supplies rental income for a landlord.
The price of a building is based partially on the income it can bring. Since a rental house or multifamily residential building brings significant income and an owner-occupied home doesn't, the price for a rental house is automatically much more than for the same owner- occupied house. It also means that potential owner-occupiers (or even a local landlord) must now compete against international LLCs and Real Estate Investment Trusts (REITs), like Blackrock International, from all over the world to buy a house.
https://www.theatlantic.com/technology/archive/2019/02/single-family-landlords-wall-street/582394/
Why is this happening? For big investors, the stock market brings an average 7% return per year. Around 2000, investors began to see increasing returns from multifamily housing: even more than for commercial property, as much as 9 to 13% annually. ["Capital City" by Samuel Stein (4/2019)]. Proposed new tax laws will make this kind of investment even more attractive in 2020.
To make institutional investment buying of residential property even easier, in 2012, the federal government, worried that the glut of fore-closed homes would remain unoccupied, incentivized some of the world’s largest private-equity groups and hedge funds to purchase these properties by allowing them to buy and finance them with government-backed loans like Fannie Mae. This transfers default risk to the government.
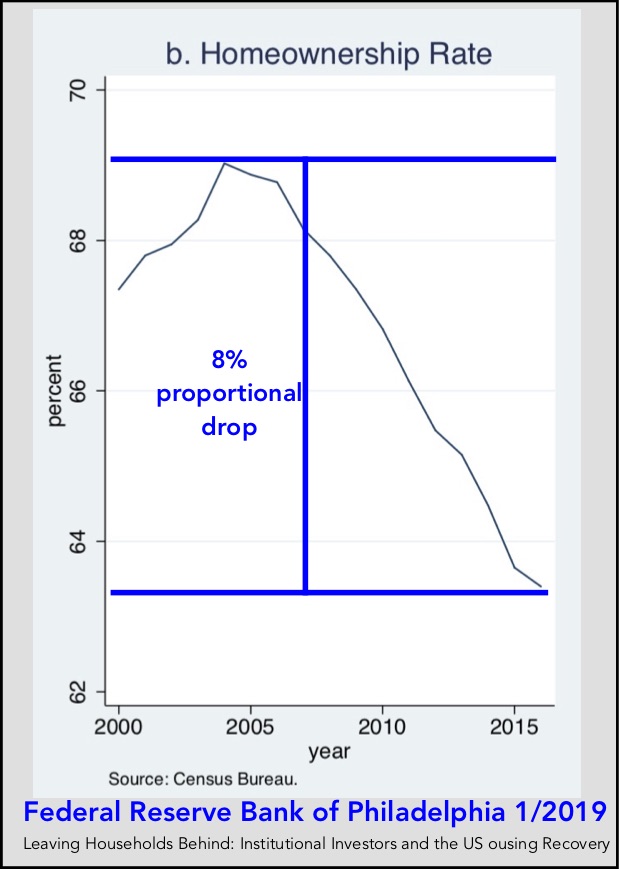
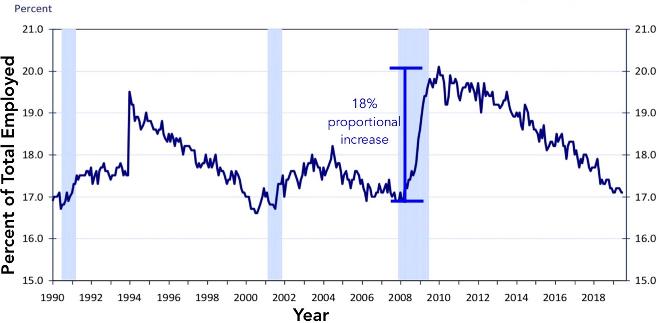
Home ownership rates in the US have dropped by almost 10% proportionally since 2005.
https://philadelphiafed.org/-/media/research-and-data/publications/working-papers/2019/wp19-01.pdf
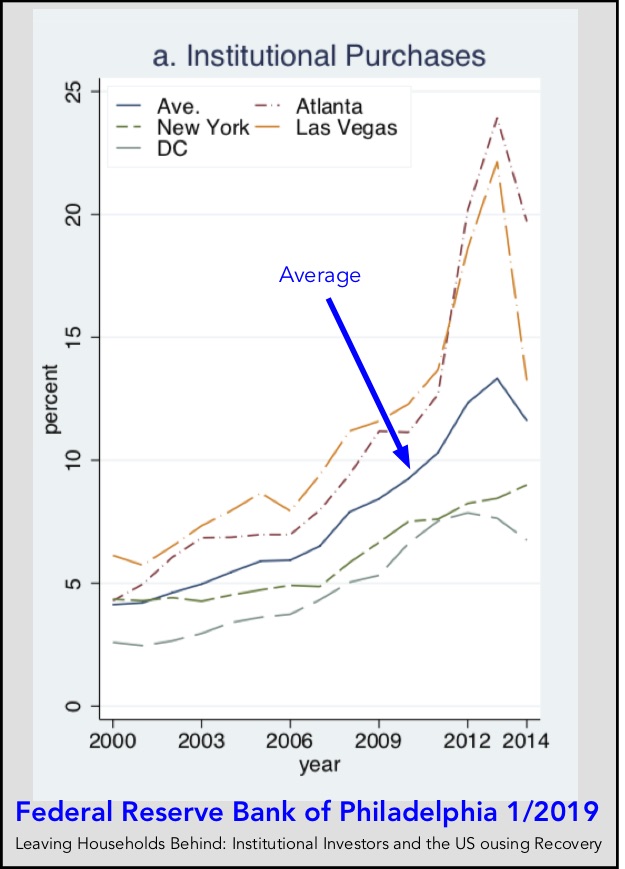
Meanwhile the percent of homes bought by investor institutions has increased from 8% to 24% of housing stockeach year from 2005 to 2013.
Missing Middle
Dan Parolek, an architect in Berkeley, came up with the concept of Missing Middle residential infill as a way to bring increased density and more affordable housing to cities in 2010.
https://missingmiddlehousing.com
This plan has been adopted all over the country by city planners, in an attempt to densify urban areas, create affordable housing, ultimately boost tax bases, and please real estate developers and investors (who contribute the most to local political campaigns). The past 9 years have seen cities all over the country change their residential zoning. The pattern has been to modify, or eliminate low-density residential zoning, and suddenly allow larger multifamily buildings in single-family neighborhoods (like the Missing Middle ordinance in Olympia).
This 24-minute video (link below) covers how a Neo-liberal approach to new housing, private-public partnership, which has transferred huge amounts of public land and tax breaks to developers. Public land is privatized and made inaccessible to the public, and income inequality increases.
https://www.truthdig.com/videos/the-defining-scam-of-the-neoliberal-era/
Owner-occupied houses have become rental units at a record rate since 2009, renting for whatever the market will bear. It's now become commonplace to buy and raze an older, cheaper house and replace it with higher-profit, multifamily units, where allowed.
However, each newly-built unit costs more than the old one, and so doesn't help affordability. This kind of development typically gentrifies neighborhoods and can displace former residents who can no longer afford to live there. But there are contradictory studies, perhaps because they were done in various towns with different conditions and styles of infill.
Missing Middle proponents assert that adding housing units of ANY kind will lower all rents, citing the simple concept of supply and demand. They reason that, even though most new housing units built are higher-end, wealthier renters will move into them, leaving behind their older, cheaper housing for poorer renters. This assumes the price of the older units go down significantly or that poorer renters get a raise. This is called "filtering": a trickle-down theory.
https://www.planetizen.com/blogs/100293-how-filtering-increases-housing-affordability
In practice, very little filtering occurs (around 2% per year). It may take 30 years for any significant effect on lower-income renters. Faster and more effective, is actually building affordable housing for the bottom 50%, whether by reduced square footage in a unit, or by subsidizing rents.
https://www.urbandisplacement.org/sites/default/files/images/udp_research_brief_052316.pdf
https://shelterforce.org/2016/11/04/housing-doesnt-filter-neighborhoods-do/
Yonah Freemark, an urban scholar at the Massachusetts Institute of Technology, studied the effects of high-rise urban-type infill in Chicago (1/19). He found that, although the price of housing went up, there was no significant increase in affordable (cheaper) units created.
https://www.governing.com/topics/urban/gov-zoning-density.html
Evan Mast found new, high-end apartments did cause some filtering over a housing "cycle". During over 6 or more “cycles" of this kind of tenantmovement over the years, he found that even the lower-income neighborhoods became involved.
I’m not sure how long 6 cycles takes (5, 10, 15 years?). If incomes are too polarized, or there isn’t much upward mobility to be had (especially in the bottom 50%), the musical chairs trade-ups might not involve the poorest neighborhoods. If the incomes in a city are too polarized, this kind of success might not be seen. It worked for his study though.
In Olympia, most new downtown housing built recently has been high-end apartments. Many of these have been granted large 8-year property tax subsidies from the City of Olympia. This has NOT created affordable rental housing, it has subsidized luxury housing by making other Olympia residents pay these taxes.
https://olywip.org/olympias-rising-tax-exempt-skyline/
The new types of buildings Olympia's Missing Middle plan would allow will be market-rate (mid-to-high-end) units, and so won't contribute to cheaper housing, except for more-affluent renters.
Most other cities mentioned in the article have had a different experience. In Seattle, New York, etc, in the residential neighborhoods where up-zoning is planned (like Olympia), these neighborhoods are attractive and need no urban renewal. They are ripe for densification, gentrification and displacement by investor groups, and unit density will increase.
The experience of other cities with Missing Middle-type infill in residential neighborhoods has shown negligible addition of cheaper units and instead, mainly an increase in middle- and high-end units.
Effects on Diversity
In many cities, like Seattle's Central District, measurements of the effects of Missing Middle housing on racial diversity in highly-segregated neighborhoods have initially implied that segregation of these neighborhoods decreases afterward urban renewal.
Looking closer, it's found instead that, poorer blacks are displaced from their own neighborhoods and replaced by affluent (mostly white) people who can afford the new housing. Between 2005 and and 2019 in the Seattle's Central District, the percentage of Blacks decreased from 36% to about 18%. These displaced blacks then escaped to poorer, whiter neighborhoods and boosted their black population. All that really happened is poor people had to move out of their old neighborhoods.
Advocates for eliminating single-family zoning and replacing it with multifamily assert that any increase in supply of any type of housing unit will automatically reduce demand across the spectrum of housing,and therefore rents. However, this is only true in the price range of the apartments built. In Seattle, rents HAVE decreased for high-end renters, since that's where the new inventory is.
But the number of cheaper rental units can actually decrease, due to their replacement by new multifamily units. And the new higher-value buildings drive up the prices of surrounding houses andbuildings for speculators, increasing prices and rents. So low-income renters continue to see increases in rents.
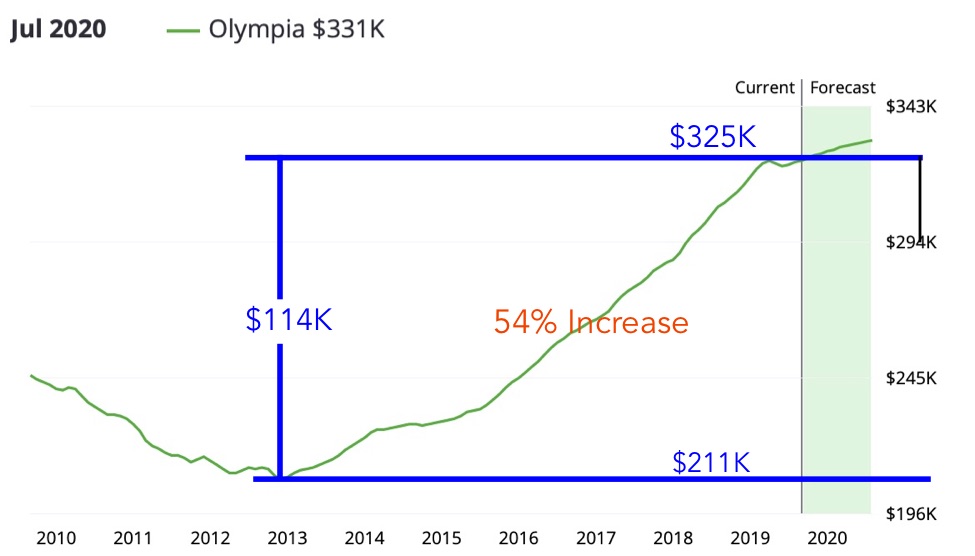
What has happened to the median sales price of a house in Olympia since 2013? It has increased proportionally by about 54%.
As mentioned earlier, apartment rental prices in Olympia have increased % on average from 2012 until 2017. In the last two years, the rate of increase has accelerated.
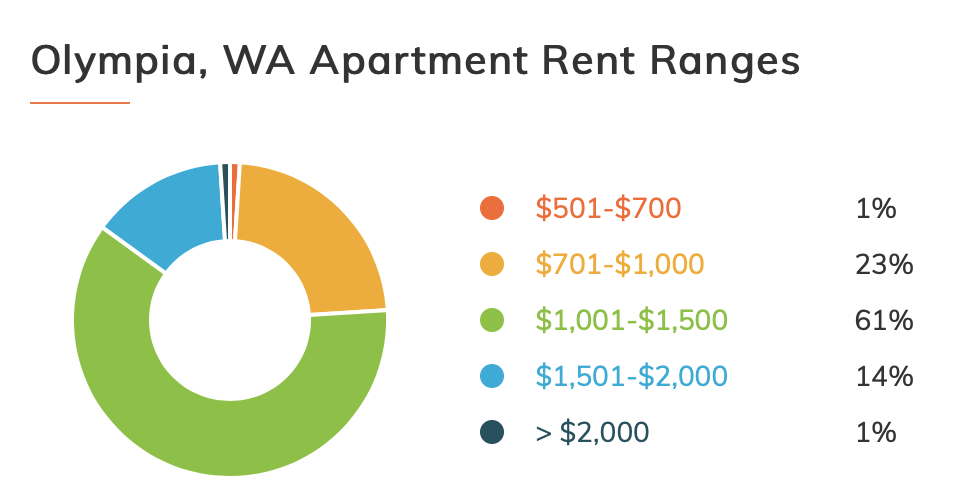
What percentage of Olympia apartments fall into each price range right now? At left, only about a quarter of rentals offer a rent that 42% of the poorest Olympia renters can afford, less than $1000.
Factors in Building and Getting Financing
Builders build for a living. It's their income. Like the rest of us, if we have a chance do the same work, but get paid more, we should. Luxury housing has a larger profit margin than cheaper housing. That's why it's always built first, while cheaper housing often doesn't get built, unless subsidies or donations are supplied.
Investors invest money they don't need to live on. Like money in the stock market, it's extra money they don't require in the present, which they hope will grow in value over the years (capitalism).
Banks are in the business of making money from the interest on loans. Like investors, they like a safe bet. If they supply money for a commercial construction loan, they must be sure the contractor is competent, has a good credit score and doesn't owe too much money already. The bank also has to be sure the value of the potential building will more than pay for the remaining principal if something goes wrong and they have to foreclose. The neighborhood the property is in, local vacancy rate, potential income from the property, and expected occupancy rate of the new building all come into play in the decision to lend money. It's not easy being a builder either.
https://www.merchantmaverick.com/commercial-construction-loans/
Vacancy Rate: When Banks Will Loan and Builders Will Build
Let's look at the pattern in vacancy rates vs average rents in Thurston County over the last two decades. An optimum vacancy rate, when builders still make a decent profit, but renters have reasonable rents, is about 5%. A normal range is found between 4% and 7%.
The graph below has a lot to look at, but I'll dissect it for you.
The % Vacancy Rate in Olympia is the orange line, with its scale at the left. You can see that it has varied between about 2% to 7% since 2001.
The Average Rent in Olympiais the red line. You can see it's gone from about $600 to $1200 since 2001.
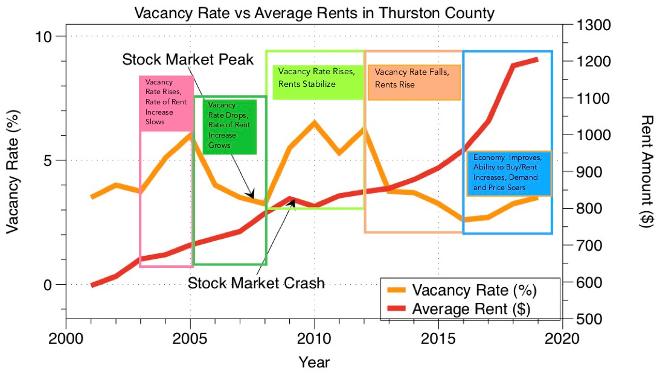
The colored boxes show periods during this time when changes occurred. You'll see generally that, if the vacancy rate goes UP, rents either go down, stabilize, or rise at a slower rate. When the vacancy rate goes DOWN, rents increase or else rise at a faster rate.
One exception is the (last) blue box, when the vacancy rate increased slightly, but people's ability to buy increased quickly because there was rapid improvement in the economy during this time. Demand soared beyond increased supply and prices sky-rocketed.
So generally, vacancy rate and rental prices go in opposite directions when there is a change.
How the IRS Prevents Undercharging for Rent
If your relative rents an apartment or ADU from you, you can legally undercharge them. For a non-relative, there is a penalty for doing this. The IRS looks at your undercharging as a way to pay them less tax, because you are artificially lowering your income. They want you to rent your unit at market value, or they will tax you for the gap between your rent and the higher rent you could ask.
https://laporte.com/knowledgecenter/tax-services/tax-consequences-of-charging-below-market-rent
Housing Solutions in Olympia?
The most important question now is, what kind, and price range, of housing do we need in Olympia right now, and how can we get it? First, what kinds of housing does Olympia have already, in what amounts, and what price? Let's start with owner-occupied single-family homes.
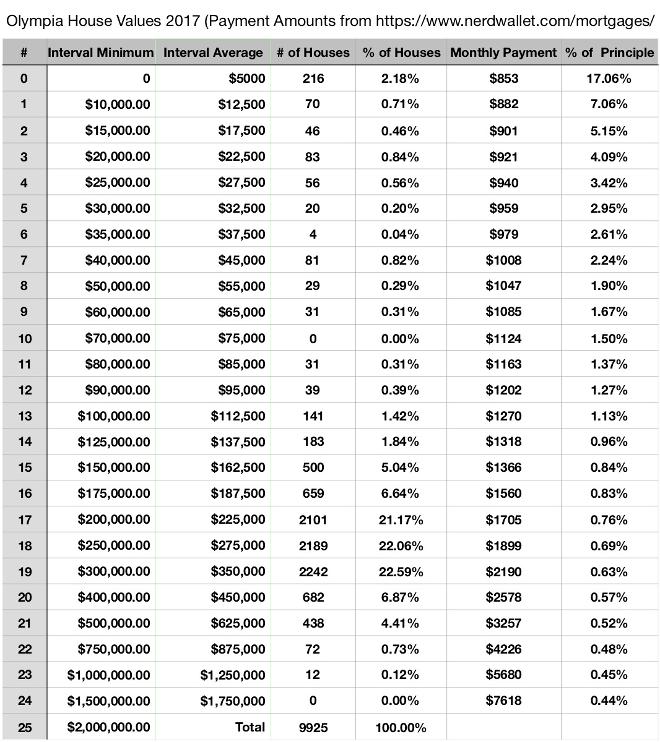
I found the a table of values of single-family homes in Olympia (below) and graphed it against the percent of houses for each value.
https://datausa.io/profile/geo/olympia-wa/#housing
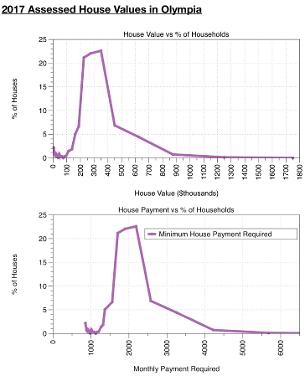
At right, from the data above, I graphed the values of houses in $ thousands on the top graph, and then their mortgage payments below in dollars.
The vertical axis of both graphs shows the percent of Olympia houses that require each minimum mortgage payment. The shapes of the graphs are, of course, identical. As you can see, no houses are available for a payment of around $1000.
I then found a table of household incomes in Olympia and the percent of households in having each income. HUD defines affordable housing as spending 30% or less of your income on housing.
housing.https://www.huduser.gov/portal/datasets/il/il2019/2019summary.odn
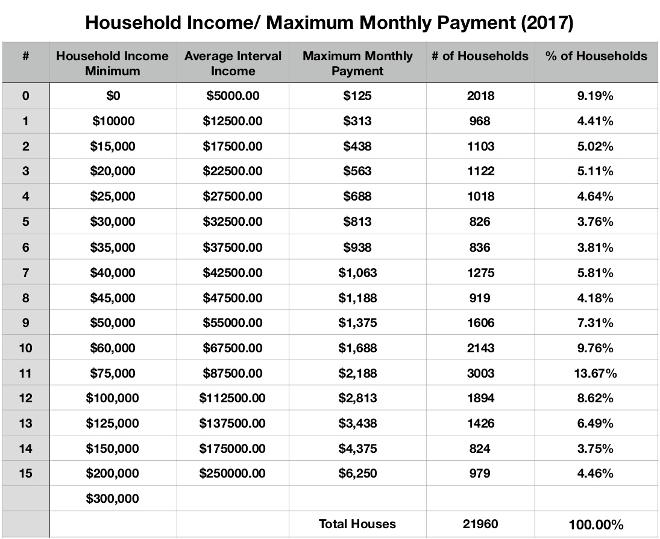
On the table below, I have taken an average of each income range in Olympia (average of 0$ to $10,000 = $5000) for graphing purposes (column 2). I've then taken 30% of this income and divided by 12 to get the maximum monthly affordable housing payment for each household group (column 5).
To calculate the monthly payment for a house of each value, I used nerdwallet, which includes location, interest rate, insurance payments, property taxes and a 20% down-payment.
Finally, out of curiosity, I showed what percent of the principal is paid in each house payment. The smaller the loan, the more you pay for your house in the end, compared to its value.
https://www.nerdwallet.com/mortgages/mortgage-calculator/calculate-mortgage-payment?trk=nw_gn1_4.0
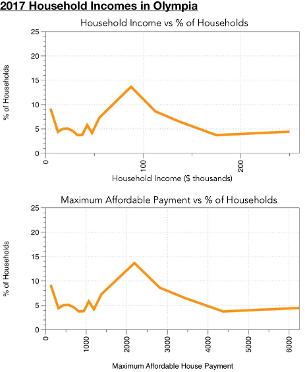
I graphed the data from the table above. The top graph shows the household income in $ thousands against what percentage of households have each income.
On the bottom graph is the maximum mortgage payment each household group could pay (30% of income). Again the graphs have an identical shape.
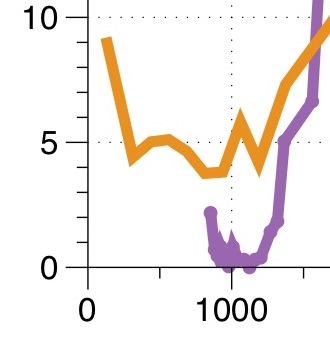
Finally, I graphed minimum house payment graph (purple line) with maximum house payment each household group could afford (orange line).
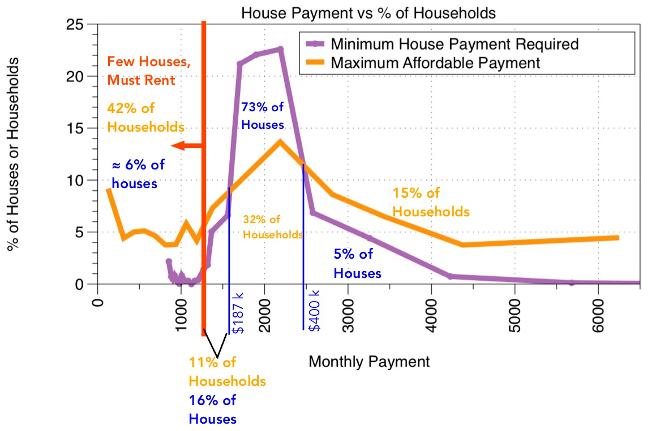
What does this graph tell us? If the orange line is higher than the purple line, it means there are fewer houses available in this category than the number of households that need them. If the purple line is higher than the orange line, there are more houses in this category than households that need them.
Reading the above tables (just under Housing Solutions in Olympia?) only about 6% of houses in Olympia have a monthly payment below $1050 (income ≤$40k per year). Basically, if you can't pay at least $1050 per month, you musdt rent, because there are few houses to buy in that range. Also, you must find a rent $1050 or below. About 42% of Olympia households can't pay rent that high.
Those able to make a monthly payment between $1100 and $1560 can find an adequate choice of houses.
For houses requiring payments between $1600 and $2500 (values between $187.5k and $400k), it seems there are many more houses than people that can afford them. This may actually show that many houses were bought two or more decades ago at a much cheaper price, but have appreciated extremely in value, so even their current owners couldn't buy them without existing equity now. On the other hand, people moving to Olympia from larger cities could afford them.
This must be the case, because the months of inventory of houses has been unusually low the past 4 years, as seen below. Single-family houses and their assets (space, privacy, light, a yard) are still very much in demand.
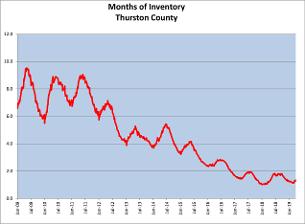
This data for Thurston County comes close to conditions in Olympia. Since 2012, months of house inventory has shrunk from about 9.5 months to less than 1.5months.
https://virgiladamsre.com/thurston-county-market-conditions-don-manzer-june-2019/
For most expensive houses on the payment graph above, it looks like there are more people that can afford these houses than houses available. This probably just shows that people who buy these houses are paying less than 30% of their income for their house.
So demand for single-family houses and their neighborhood amenities is still high, but rentals with rents less than $1050 are sorely needed.
Affordable (<$1000)Rents is the Biggest Issue
Let's focus on Olympia's REAL housing shortage, the 42% of Olympians who can't afford a house: the RENTERS, the left-most part (at right) of the payment graph above. How many householdscould qualify for HUD housing vouchers in Olympia and Tumwater, if they were available? Below, extremely Low Income is defined as 60% of Very-Low Income, or about 30% of the median income of $77,700.
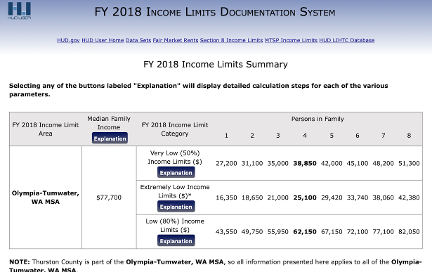
In 2019, the average size of a household in Olympia is a little over 2.2 people. On the table above, for a two-person household, Low (household) Income would be roughly below $62k, Very Low Income less than about $39k, and Extremely Low would be below about $25k. Reading the Household Income/ Maximum Monthly Payment 2017 table above, this is a total of 9166 out of 21,960 households (42%). .
$0 to $25k income is ≈28% of Olympia households.
>$25k to $39k income is ≈13% of Olympia households
>$39k to $62k income is perhaps ≈11% of Olympiahouseholds
So ALL of the 42% of people who can only pay under $1050 for rent and utilities in Olympia could qualify for HUD subsidies. But there are no new HUD housing vouchers available, and those that exist may see reductions soon.
The lowest income fraction of these, about 600 people in Olympia in 2019, are homeless, won't be renting, but will have to depend on free homeless shelters.
What are the typical rents for new apartment buildings downtown. These are from 123 4th Street
https://www.apartments.com/123-4th-apartments-olympia-wa/02klpk2/
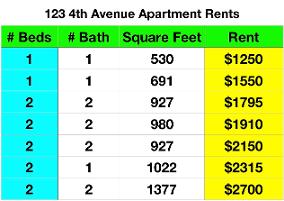
For the rest, that means that somehow we must build lots of apartments, ADU's, SRO buildings, or rented rooms in an existing house, that rent from $100 to about $1050 per month. That's only about 25% of apartments available right now.
How do you build apartments cheaply enough to be in that rent range? They must be avery small square-footage. They must also be built as efficiently (low cost) as possible.
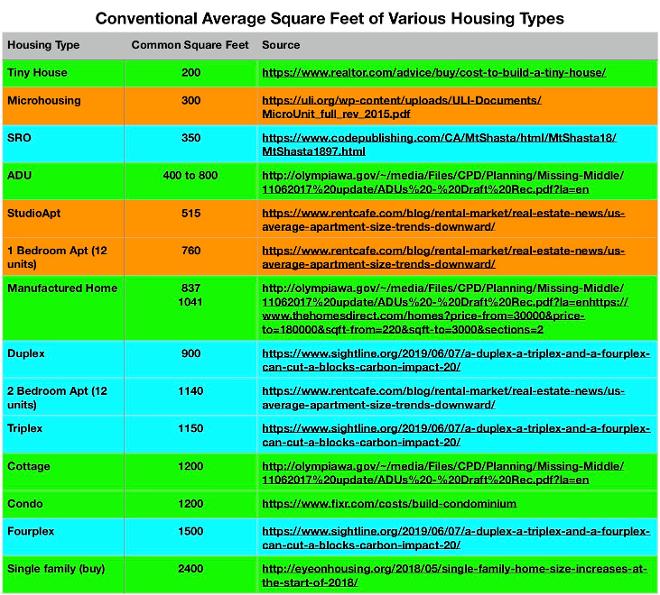
What kinds of housing are prescribed by our Comprehensive Plan in Olympia’s single family neighborhoods (pre-Missing Middle, which has been invalidated on appeal): single-family (SF) homes, manufactured homes, single cottages and ADUs, tiny houses, 4-unit condo building, and duplexes in R-6-12 neighborhoods, and duplexes in R-6-12 neighborhoods. Below are some of the more specific guidelines in the Comp Plan, regarding land use, zoning and allowed housing types.
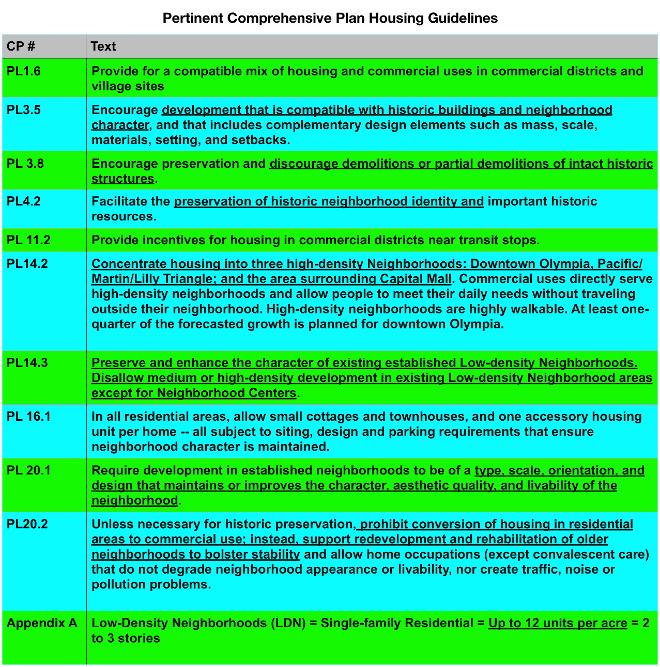
What new kinds of housing would be allowed in Missing Middle? duplexes, triplexes, fourplexes, 12-unit townhouse buildings and cottage developments, SROs. Generally they are much bigger buildings than houses.
Below, discussing rent amounts, I’ve also added housing types that either aren’t allowed in Missing Middle yet, but may be in the future, like microhousing in other cities, or which are allowed in other Olympia zones, like very-large apartment buildings.
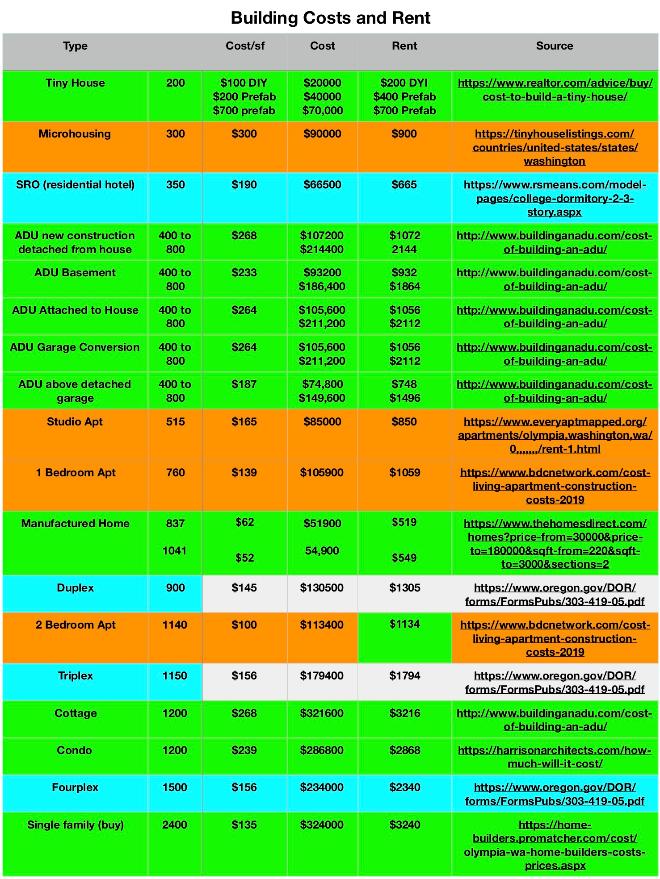
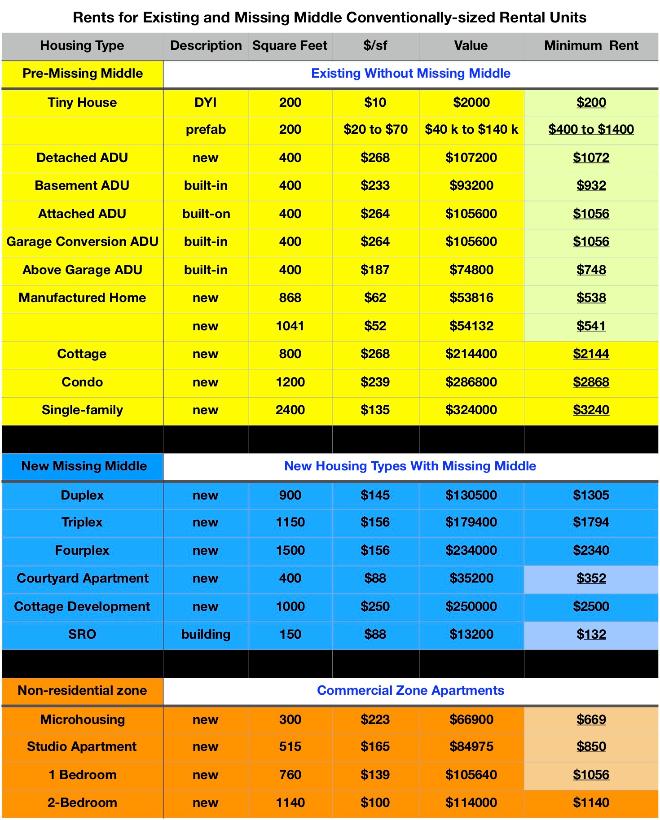
Building Costs vs Minimum Rent Charged
If you build a rental, the rule of thumb is to rent it for at least 1% of its building cost. Of course, the market usually determines the rent, but the 1% of the construction cost will show the least rent that’s sustainable for the landlord. How much does it cost to build each type of housing in Olympia?
The assumptions on the tables below are:
• Tiny houses can be built DYI for between $10 and $20/square foot. However a 200 sf pre-built tiny house ranges from $20,000 to $70,000. I’ll list 3 prices for them.
https://tinyhouselistings.com/countries/united-states/states/washington
* I’m assuming new construction. Land and utility hookups and City fees aren’t included.
• Estimates are conventional averages, from various sites and converted to Olympia’s CPI
• The cost of a house depends heavily on materials quality and the complexity of the building shape (box or corners, gables, etc), appliances fixtures, etc.
• As the total square footage of a house increases, all other things being equal, the cost per square foot decreases
• The average Olympia apartment size is 868 sf, but I’ll estimate for average 1 and 2-bedroom apartment (760 sf and 1140 sf). A standard manufactured home is about 868 sf and prefab.
• I’ll assume that a cottage would cost the same per square foot as a new detached ADU, but be 1250 sf, as prescribed in MM
• ADU costs below are from Portland and some other housing types are from Seattle (CPI is 12% more than Olympia, Seattle 13% more) and the cost per square foot values given have been multiplied by .88 and .87 respectively.
https://www.craftsman-book.com/media/static/previews/2017_NBC_book_preview.pdf
• I’ll assume SF homes, manufactured homes, duplexes and condos are built to a “Class 5” quality (“Good Standard).
• See Appendix A for the sources of these numbers
In Green on the tables below, are the housing types allowed pre-Missing Middle.
In cyan are new housing types allowed by MM. Their sizes ill be according to MM specs
In Orange are housing types allowed in other zones of Olympia, or other cities, but not in Olympia.
From smallest to largest square footage, here is a summary of rents for each housing type in Olympia. Lighter-colored cells in the Minimum Rent column are those roughly below $1100. Notice that 9 types of affordable housing are already allowed in residential neighborhoods without Missing Middle. Missing Middle ads 2 more. Commercial or high-density multifamily (already-allowed) add 3 more.
Summary of Rents Below $1050
Housing Type? Zoning Allowed?
• 200 sf Tiny houses* ($400 to $1050) Low-density Residential
• 300 sf Micro-housing ($669) Not Allowed in Olympia
• 150 sf SRO’s ($132) Missing Middle
• 400 sf: Any ADU ($538 to $1072) Low-density Residential
• 868 sf Manufactured Home ($538) Low-density Residential
1041 sf Manufactured Home ($541) Low-density Residential
• 515 sf studio apartment ($850) Commercial
• 760 sf 1 bedroom apartment ($1056) Commercial
https://tinyhouselistings.com/countries/united-states/states/washington
As you can see, to get rents below $1100 requires very small square footage and less-expensive or DIY construction techniques.
Under $1100 rent is possible already in three types of SF neighborhood-type housing allowed now. It could be tiny houses, 400 sf ADUs, or manufactured homes.
With Missing Middle, Courtyard Apartments or SROs could be added.
If micro-housing came to Olympia, or large apartment buildings were sited in General Commercial, HDC, RM-18, UW-Housing, Urban Residential, High-rise residential, they would be affordable to middle- income renters.
For rentals with more expensive market rate rents, the cheapest among them would be found in bigger ADU types in Low Density residential neighborhoods, and larger apartment buildings (24 - 60 units) including studios, allowed in HDC and commercial zones along urban corridors (as prescribed in the Comprehensive Plan).
Added supply of these medium to higher-end apartments, tri- and 4-plexes and large condo buildings in commercial areas would reduce rent in this price range. Perhaps the allowed unit density in these buildings in commercial areas could be increased to allow more density adjacent to transit and services.
By keeping larger residential multifamily buildings (MM) out of low-density residential neighborhoods, housing prices there would not rise so fast, because their lower-profit nature might not be as attractive to investors buying them up as rentals. This would help stabilize residential house prices and rents, yet allow increased, affordable (<$1100) units and higherdensity in low-density residential neighborhoods.
Summary
Well, what have we learned?
Unaffordable housing today is due mainly to
• Dramatically-increased nation-wide income inequality
• Replacement of living wage jobs by part-time low-wage jobs that offered no benefits, starting in 2008
• Housing starts were about half of normal from 2008 to 2017. This was 9 years where new housing supply fell short of keeping up with actual housing needs
• Decreasing buying power of minimum wage
• Eliminated HUD rent vouchers for the very-poor
• Would-be home-buyers' (25 to 54 year-old age group) incomes decreased from 2009 to 2016, causing 9 years of pent-up demand.
• Between 2016 and the present, wage increases caused a sudden, large increase in citizen buying power, huge demand, and sktrocketing house prices.
• International investor groups bought an average of 8% of owner-occupied homes each year, converting them to rentals, or razing them to build higher-profit multifamily housing.
• The range of housing types we really need most in Olympia have rents < $1100 (about 42% of renters).
• Missing Middle housing doesn't follow the Comp Plan in compatibility, introducing dis-allowed types of housing in low-density neighborhoods, exceeding unit and parking density limits, encouraging tear-downs of older houses, working against maintaining or enhancing neighborhood character. Except for SROs and Courtyard Apartments, new MM housing doesn't produce rents under $1100 .
• The existing housing types allowed in low-density neighborhoods can offer most of the lowest rent options. This is also true for existing commercial and high-density multifamily zones.
• Cities just don't have the money to solve these housing problems themselves
There are three things nationally, which can make housing more affordable:
• Tax the top 10% to create funds for infrastructure and housing solutions
• Increase wages and benefits for workers
• Pour adequate funding into HUD and state-administered housing programs.
• Create public housing in a variety of ways, as suggested by Samuel Stein in "Capital City". Don't allow sunset clauses, where at some point this public housing could someday be sold to developers. It's happened too many times, as detailed by Samuel Stein. Buy his book, or for now, read the summary at
https://noolyupzone.yolasite.com/Summary-of-Capital-City-by-Samuel-Stein.php
• Another method of increasing infill and affordable housing is a housing trust. To find out how this works to create permanently-affordable, non-gentrifying housing, see:
https://olywip.org/hope-for-a-future-of-permanently-affordable-housing/
• Most Olympians expressing enthusiasm for Missing Middle were thinking MM would finally allow tiny houses and ADUs, but these are already allowed without MM.
• The City could make it easier for people to build ADUs and Tiny houses if they made available free, approved plans for various styles Another big help would be to reduce fees for these smaller structures.
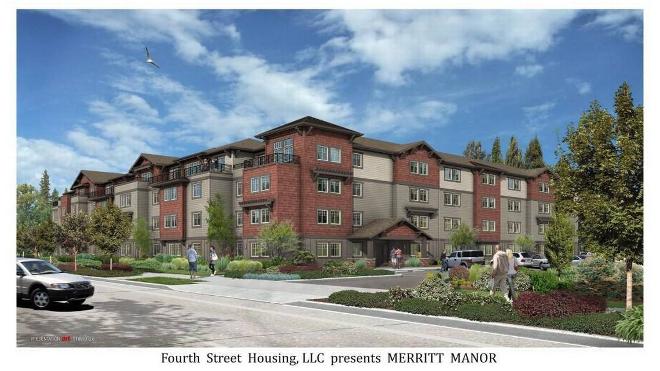
• A great example in Olympia of a non-profit organization building affordable housing, geared towards those making 60% or less of median income, is the Merritt House, built by the non-profit 4th Street Housing LLC. This housing on the former site of the Bailey Motor Inn, began witha donation from Ann Sarver-Merritt in 2015. Architects Glen Wells and Developer Scott Wammack, and Olympia Federal Savings then helped design and finance the project.
https://www.theolympian.com/news/local/article165871862.html
Meanwhile, if you don't know much about the City's proposed infill plan, Missing Middle, go to https://noolyupzone.yolasite.com
Appendix A